

Twitter (TWTR) stock price has been on a strong momentum since the January 2020. The momentum followed a drop at the of the 2019. Year-to-date, Twitter stock price has risen by 47%. From July 2020, Twitter stock price has risen by 47%. AroniSmart™ team, leveraging the Machine Learning Time Series capabilities and Dominance Analysis of AroniSmartIntelligence™, has looked at the trends of TWTR vs other 13 companies and came up with insights and projections on the dynamics.
A little bit of the usual investment research before coming back to AroniSmart™'s findings.
Twitter Momentum
Twitter (TWTR) has been improving its revenues and returns since 2017. Since then, Twitter has increased revenues, while decreasing its negative losses and turning operating income to positive returns, despite increasing costs of revenues. In the past, AroniSmart Sentiment Analysis has shown that Twitter's momentum has been fueled by initiatives to address concerns (see: AroniSmart Tech News on Twitter here )
Addressing Concerns at Twitter
Since 2018, Twitter has heavily invested in new new technologies related to Security, Mobile, and AI. Hence over the last years, Twitter appears to have slowly but consistently addressing concerns raised by investors and others, by investing heaving in new capabilities to improve Security and User Engagement while controlling or cutting costs.
AroniSmart™ team analyzed Twitter's performance dynamics, leveraging the Support Vector Machine and Dominance Analysis capabilities of AroniSmartIntelligence™ and uncovered interesting insights. The team analyzed the performance of TWTR vs 13 other internally selected stocks from Oct 2019 to Oct 2020.
AroniSmartLytics™ Analysis: Twitter behaves like several stocks, but not the same
Based on the analysis, it was found that most of these stocks basically follow similar trends. Also, they are all impacted by the market conditions. However, the analysis found important nuances.
Key findings started with a positive view: most of the stocks had an upward momentum over the period spanning Oct 2019 - Oct 2020. However, like the general stock market, they faced a slowdown and high volatility in Q1-Q2 2020 before starting a bounce back. Trendwise, since May 2020, the stocks have been on a catching up journey reaching or a lot of of them mostly surpassing the previous price levels.
From the analysis, it is clear that some stocks like TSLA, NTFLX, and AMZN had stronger upward momentum, since May 2020. TSLA experience the strongest, rather exceptional, upside. In Q3 2020, most stocks had basically back to or above the previous levels and engaged into a bullish rally. In Q1 and early Q2 2020, Twitter's momentum was significantly impacted by the market conditions, but starting in September 2020, it bounced back (see chart below). Since then, Twitter stock has maintained the momentum.
Figure 1: Key Stocks Price Trends over the period of October 2019 - October 2020
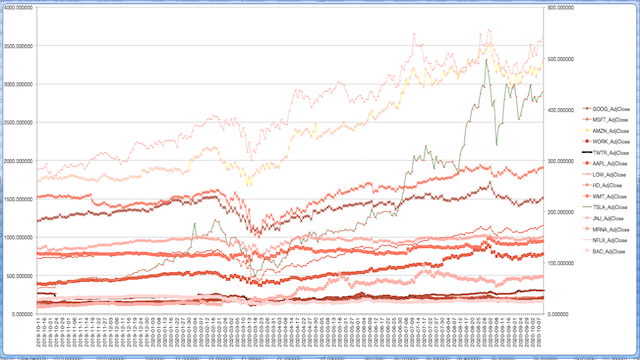
Figure 2: Twitter Stock Price Trends and AroniSmart Projections Analysis Between October 2019 and March 2020
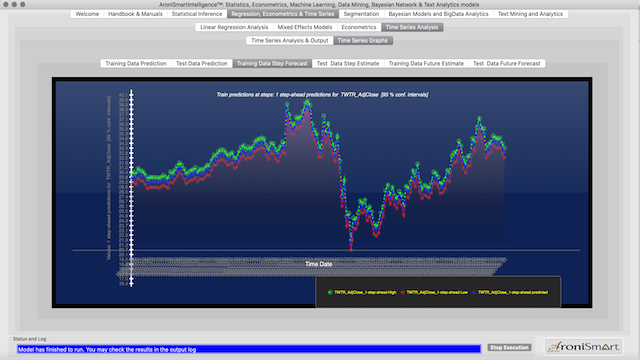
Figure 3: Twitter Stock Price Trends and AroniSmart Projections Analysis Between October 2020 and May 2020
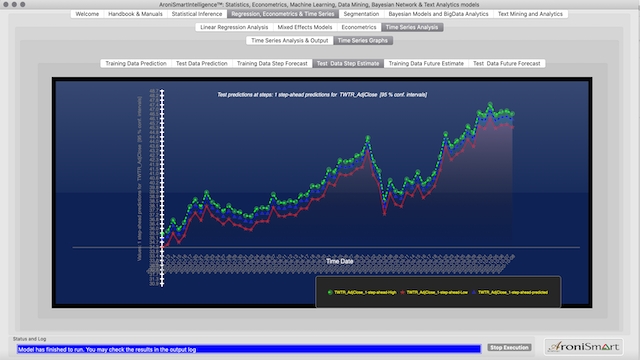
Figure 4: Twitter Stock Price Trends and AroniSmart Projections Analysis Between May 2020 and October 2020
AroniSmartLytics™ modelling (see results on the Twitter Close Price Drivers screen shot ), shows the prices of the stocks that appear to mirror each other: a high opening for the stocks that tends to lead a decline or slow down in Twitter's closing price and a high opening for the stocks that tends to lead an increase or growth in Twitter's closing price. Q2-Q4 2019 and Q2 - Jul 2020 dynamics appear to positively impact Twitter's prices, whereas Q1 has been challenging.
Twitter (TWTR) appears to build a momentum similar to that of GOOGL, WORK, NTFLX, MSFT, HD, WMT, TSLA, and BAC. At the same time, the upside of TWTR appears not to align with the prices of AAPL, AMZN, JNJ, LOW, and MRNA.
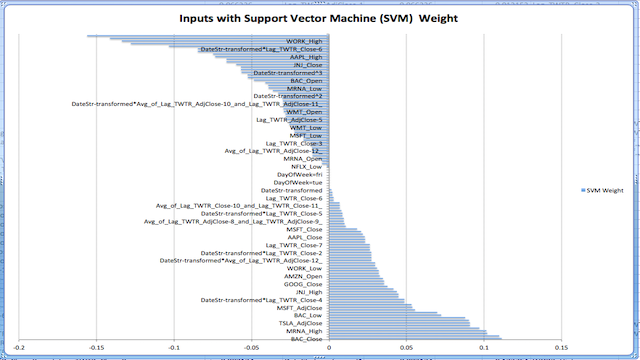
Figure 4: Twitter Stock Price Drivers Support Vector Machine Weights: October 2019 and October 2020
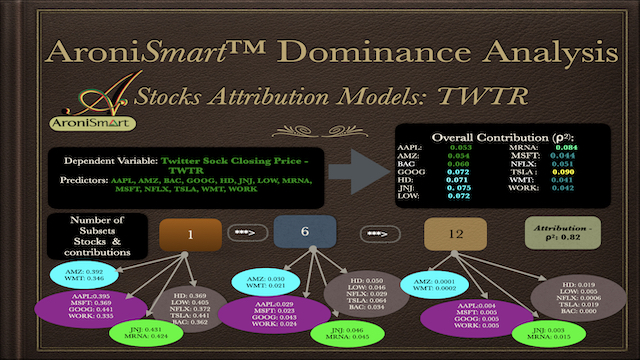
AroniSmartLytics™ Dominance Analysis confirms Support Vector Machine results: Twitter momentum explained by momentum of other stocks.
AroniSmart™ team analyzed Twitter's performance dynamics, Dominance Analysis capabilities of AroniSmartIntelligence™ and uncovered i insights confirming the performance dynamics of TWTR vs 13 other internally selected stocks from October 2019 to October 2020. See below:
More detailed analyses can be conducted using AroniSmartIntelligence™ Big Data, Machine Learning, Time Series and Sentiment Analysis capabilities.
Advertisement
GET ARONISMARTINTELLIGENCE on App Store

AroniSmartIntelligence, the leading tool for Advanced Analytics, Machine Learning & Data Science
Statisticians, Data Scientists, Business and Financial Analysts, Savvy Investors, Engineers, Researchers, Students, Teachers, Economists, Political Analysts, and most of the practitioners use Advanced Analytics to answer questions, to support informed decision making or to learn.
AroniSmartIntelligence™ is a leading Advanced Analytics, Machine Learning and Data Science tool, with optimized cutting edge Statistics models, Econometrics, Big Data and Text Analytics.
AronismartIntelligence™ includes modules covering Machine Learning and Big Data mining, Unstructured Text Analysis, Sentiment and Emotion Analytics, Bayesian Statistics and other advanced analytics.