

Since the beginning of the year, the stock market has been on a rollercoaster. On January 31, 2022, the stocks rose, in anticipation of a busy week of earnings ahead, but the volatility remains, even though they ended up high on Feb 1, 2022. The S&P 500, DOW, NASDAQ, Russell 2000, Crude Oil, Gold all traded higher. But the picture until January 28, 2022 has been historic: a widespread volatility after a fueled momentum over 2021. Hence, major questions coming from investors and users leveraging AroniSmartIntelligence™ and AroniSmartInvest™ capabilities remain focused on the findings from analyzing the connection among the key Stock market indices, especially NASDAQ vs Dow Jones(DJI), S&P 500, Russell 2000, Gold, and Oil and generating some meaningful trends. Based on these questions, AroniSmart™ team, has continued to leverage the advanced analytics tools to analyze the trends of the key market indices. The key findings are captured in this article.
The performance in the month of January 2022 has significantly been impacted by the Federal Reserve's latest monetary policy regarding inflation, the continued uncertainty on the Chinese economic policies and somewhat the impact of the COVID-19 pandemic new variants. Economists and most major banks expect the Federal Reserve to raise rates, by a quarter-poin, five times to seven times this year.
Hence, year-to-date (YTD) by January 28, 2022, the stock indices had very poor performance and were significantly down with: S&P 500: -7.00%, NASDAQ: -12.0%, DOW: -4.4%. The trends appeared to reverse by January 31, 2022 and Feb 1, 2022, but the market remains highly volatile, swinging between the opening and the closing of the market.
AroniSmart™ team, leveraging the Machine Learning Time Series capabilities, including Support Vector Machine, and Neural Network Analysis of AroniSmartIntelligence™ , has analyzed the trends of key stock market indices (DJI, NASDAQ, S&P 500, Russell 2000, Oil, Gold) between early Jan 2021 and the end Jan 2022 and came up with insights and projections on the dynamics.
The insights are presented below (for disclaimer and terms, check AroniSoft website. For related analyses of Stock Markets using Time Series, Dominance Analysis, and Neural Network capabilities see here AroniSmartIntelligence™ in Action: Time Series Support Vector Machine and Neural Network Analysis of Stock Market Indices, Gold and Oil in January 2021 - January 2022).
The analysis produced the different measures of forecasting accuracy, including directional accuracy of Stock market indices. Directional accuracy is an important statistic when ones tries to look at the prediction of a given stock market indice vs others, for example, as in this case, the NASDAQ , S&P500, or DJI Adjusted Closing Price as a function of Open, Low, High, and Closing Prices and volume of other stock market indices, Gold, and Oil. There was also good insights from Dominance analyses that was performed to see whether there are major connections among indices, assuming investors are moving from some market indices to others, especially from tech dominated NASDAQ to DJI, or from stocks to Gold and Oil.
A little bit of the usual investment research before coming back to AroniSmart™'s findings.
Indices Momentum and Downward Trend
In general all indices have experienced an upward momentum over 2021 and to January 7, 2022: Dow Jones (.DJI) has grown by 16.84% to 36,231.66; S&P 500 (.INX) by 23.09% to 4,677.03; Nasdaq Composite (.IXIC) by 14.57% to 14,935.90; Russell 2000 Index (RUT) by 4.25% to 2,179.84, Crude Oil by 50.7% to 78.95 and Gold by -1.93% to 1,794.00.
Then, starting with the second week of January 2022, all stock indices have decreased significantly: Dow Jones (.DJI) has decreased by 3.32%; S&P 500 (.INX) decreased by 5.26%; Nasdaq Composite (.IXIC) decreased by 8.98%; Russell 2000 Index (RUT) decreased by 9.75%, Crude Oil increased by 17.42% and Gold decreased by 1.53%.
Hence, the dynamics of all the stock indices appear aligned, with minor differential trends. All the indices, except Crude Oil and Gold, have been behaving similarly. This finding may suggest that the growing inflation and the expected Federal Reserves economic policies are the major drivers of the market, while the impact of various sectors and the specific composition of the different indices played a minor role. Another finding is, YTD, that value stocks appear to have, relatively, performed better that growth stocks.
Anothe major factor on the latest dynamics is the earnings reports from major corporations. Companies such as Bank of America, Apple Inc (AAPL), MicroSoft (MSFT), Tesla(TSLA), Visa Inc (V) beat the projections. Other major companies such as Alphabet (GOOG), Amazon (AMZN), Meta Platforms (FB), Merck (MRK) will also report very soon and are expected to outperform the expectations.
Advertisement
GET ARONISMARTINVEST, A LEADING INVESTMENT RESEARCH TOOL, BASED ON Advanced Analytics, machine Learning and Data Science on App Store -- click here 
Similar Trends with Differential Nuances.
AroniSmart™ team analyzed stock indices performance dynamics, leveraging the Econometrics and Time Series Support Vector Machine and Neural Network Multilayer Perceptron capabilities of AroniSmartIntelligence™ and Machine Learning and Sentiment Analysis of AroniSmartInvest™. The team uncovered interesting insights, as shown below. The team analyzed the performance of NASDAQ, DJI, S&P500 Adjusted Close vs Open and High prices of the other indices (DJI, S&P 500, Russell 2000, Crude Oil, and Gold) , and each indice's Adjusted Close vs other indices prices (open, low, high, adjusted close) and volume, from January 11, 2021 to January 31, 2022.
From the analysis, it was found that these indices basically follow similar trends. Also, they are all similarly impacted by the market conditions. However, the analysis found important nuances.
The key findings highlight: the indices studied had an upward momentum over most of the period. Trendwise, in late Q2- early Q3 2021, the stocks reached high or record price levels. Then in September and October, 2021, the dynamics pointed to a slow down, downward trends, seesaw movements, and there were major speculations about a potential correction. The volatility increased in Q4 2021. In early January 2022, all indices started giving up some gains and by January 28, 2022, they were significantly down, execpt for Oil. On January 31, all indices went up vs January 28, 2022.
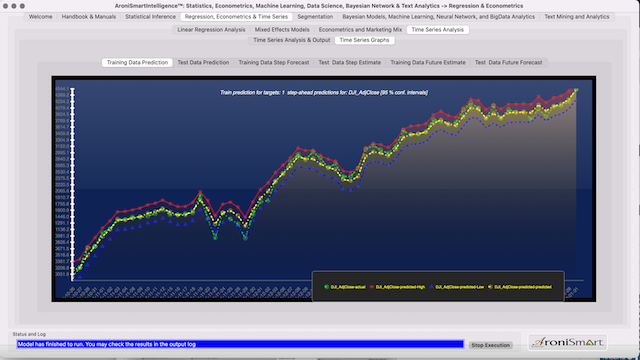
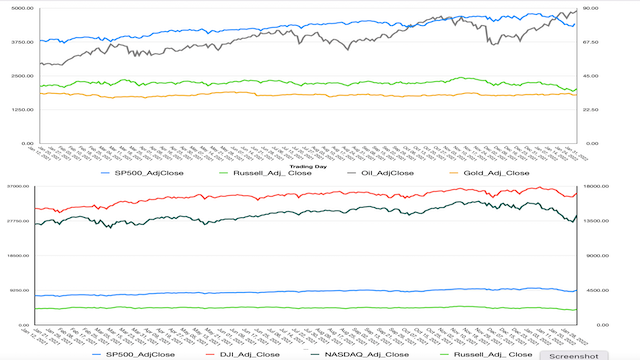
Figure 1: Key Indice Price Trends in Jan 2021-Sep 2022 -- Dow Jones (DJI) Training Data model.
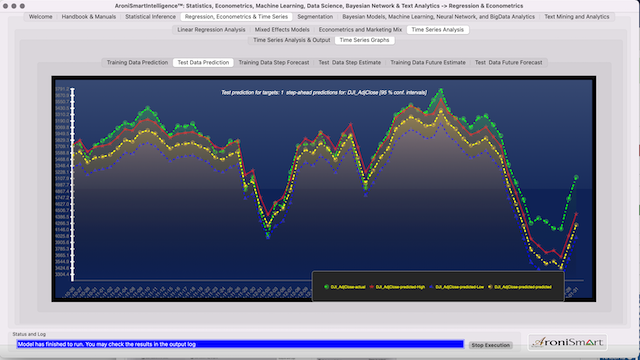
Figure 2: Key Stocks Indices Trends in Oct 2022- Jan 2022 -- Dow Jones (DJI) Test Data model.
Over 2021 all the stocks indices built on an earlier momentum, almost following similar trends.
By July of 2021 most indices were above the average Q1 2021 levels. In early Q2 2021, all indices momentums were significantly impacted by the market conditions. In late May 2021, they bounced back and maintained momentum until late September 2021 (see charts below). Since then, the indices have been experiencing seesaw dynamics. The new market conditions, including the news about the pandemic have severly impacted all indices since December 2021 into January 2022. As expected, the indices do not exactly follow the same trends and projections, neither in training nor in test data (see DJI and NASDAQ examples below).
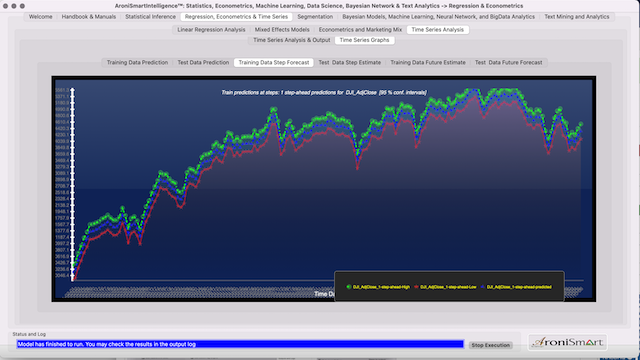
Figure 3: Dow Jones (DJI) Step Estimate Oct 2021 - Jan 2022
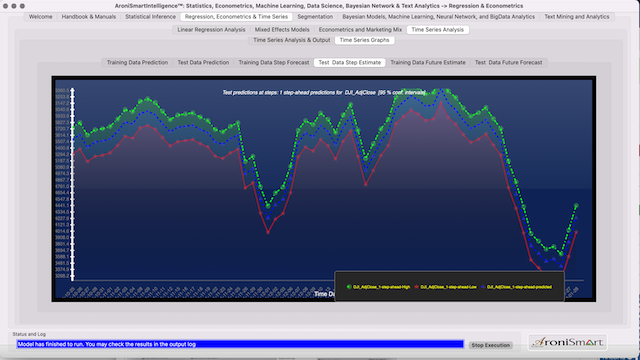
Figure 5: DJI Stock Market Index Trends and AroniSmart Projections Analysis Between July 2021 and January 2022
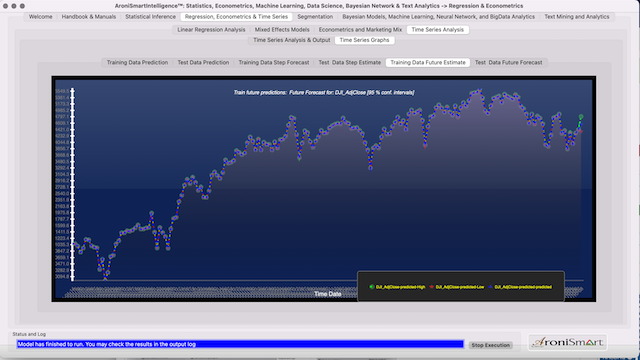
Figure 5 :DJI Stock Market Index Trends and AroniSmart Future Estimates Analysis Between Jan 1 2021 and October 2022
AroniSmartIntelligence™ modelling shows the stock indices that appear to mirror each other: a high opening for the stock market indices that tends to lead a decline or slow down in NASDAQ's adjusted closing price and a high opening for the stock market indices that tends to lead an increase or growth in NASDAQ's adjusted closing price. Late Q4 2020 - Early Q1 2020 and late Q2- early Q3 dynamics appear to positively impact NASDAQ Index, whereas the end of Q3-early Q4 2021 appears to have been challenging.
AroniSmartIntelligence™ analysis, using Time Series Support Vector Machine modelling and Neural Network Multilayer Perceptron, below, shows the weights of the different indices and the forecast statistics. From the statistics, directionary accuracy is in general high, pointing to overall similar dynamics across all market indices.
AroniSmartLytics™ Neural Network Analysis confirms Time Series Support Vector Machine results: NASDAQ and DJI momentum negatively impacted in late Q1 2021 - early Q2 2021, late Q3 2021 and late Q4 2021 into January 2022, generally aligned with the momentum of most of other stock market indices.
AroniSmart™ team analyzed NASDAQ's performance dynamics using Neural Network Analysis capabilities of AroniSmartIntelligence™ and uncovered insights confirming the performance dynamics of NASDAQ vs other market indices from January 2021 to January 2022.
See below:
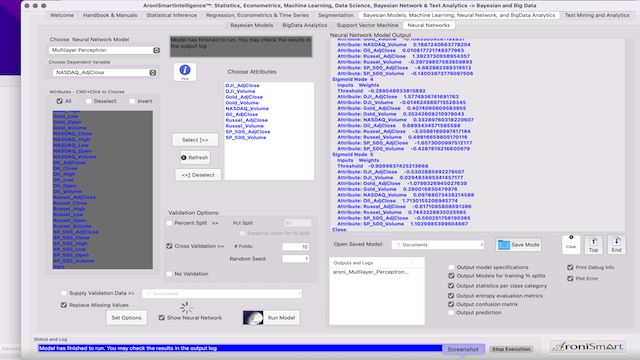
Figure 6-a: DJI Stock Index Dynamics - AroniSmart Neural Network Analysis Results for the Period Between January 2021 and January 2022
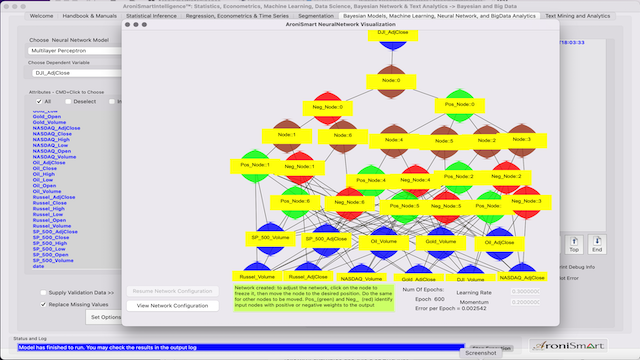
Figure 6-b: DJI Stock Index Dynamics - AroniSmart Neural Network Analysis Results - Model setup and network for the Period Between January 2021 and January 2022
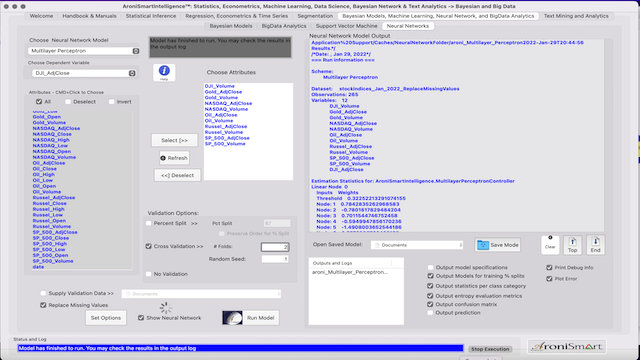
Figure 6-c: DJI Stock Index Dynamics - AroniSmart Neural Network Analysis Results - Weights for the Period Between January 2021 and January 2022
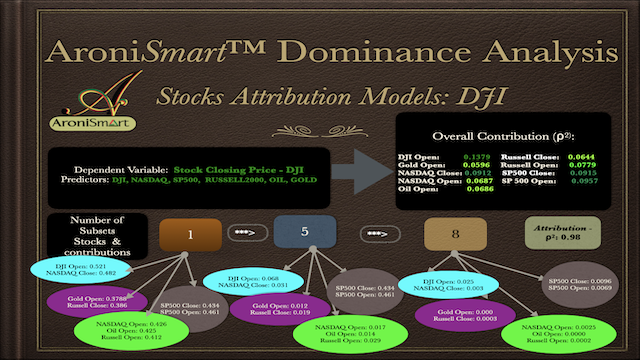
AroniSmartLytics™ Dominance Analysis confirms Support Vector Machine results: Stock Indices momentum impacted in 2021 and generally aligned with the momentum of most of other stocks.
AroniSmart™ team analyzed DJI performance dynamics using Dominance Analysis capabilities of AroniSmartIntelligence™ and uncovered insights confirming the performance dynamics among all the stock market indices, especially DJI vs SP500, NASDAQ, Oil and Gold v from January 2021 to January 2022. See below:
More detailed analyses can be conducted using AroniSmartIntelligence™ Big Data, Machine Learning, Time Series and Sentiment Analysis capabilities.
For more on AroniSmartIntelligence and AroniSmartInvest capabilities, visit AroniSoft web site by clicking here. AroniSmartInvest™ and AroniSmartIntelligence ™ are available on Apple's App Store.
©2022 AroniSoft LLC
Advertisement
GET ARONISMARTINTELLIGENCE™ on App Store


AroniSmartIntelligence™, the leading tool for Advanced Analytics, Machine Learning & Data Science
Statisticians, Data Scientists, Business and Financial Analysts, Savvy Investors, Engineers, Researchers, Students, Teachers, Economists, Political Analysts, and most of the practitioners use Advanced Analytics to answer questions, to support informed decision making or to learn.
AroniSmartIntelligence™ is a leading Advanced Analytics, Machine Learning and Data Science tool, with optimized cutting edge Statistics models, Econometrics, Big Data and Text Analytics.
AronismartIntelligence™ includes modules covering Machine Learning and Big Data mining, Unstructured Text Analysis, Sentiment and Emotion Analytics, Bayesian Statistics and other advanced analytics.