


One of the major foundations in sound advanced analytics that involve Statistics, Data Science, and Machine Learning is mastering the area of probability distributions. To achieve their modelling and analytics goals, savvy statisticians, data scientists, and advanced modeling analysts need to have a good grasp of three keys areas in statistics: 1) understanding the probability distributions, including their relationships, 2) being able to select the best probability distributions and 3) Understanding and selecting the right statistics test.
Several approaches exist to address these needs and requirements. Given the importance of this foundation in the advanced analytics, machine learning and data science, AronismartIntelligence, a leading advanced analytics tool, provides a module specifically dedicated to addressing such needs.
In general, the approach includes the following steps, for statisticians and data analysts:
- Start with a good understanding of the data collection and normalization
- Get relevant information regarding the variables under consideration, including historical data, collection, conditions, etc,
- Understand the types: Nominal, Ordinal, Discrete, Continuous?
- Propose and describe the potential probability distribution by taking into account the features and conditions identified in the data for the given variable.
- Plotting data to identify potentail probability distributions.
- Determine the parameter values for the distribution. Each distribution type has its own set of parameters.
- Try to identify all potential probability distributions that describe or apply to the data with more accuracy in estimating or training the models or better projection.
- Select accurate test statistic.
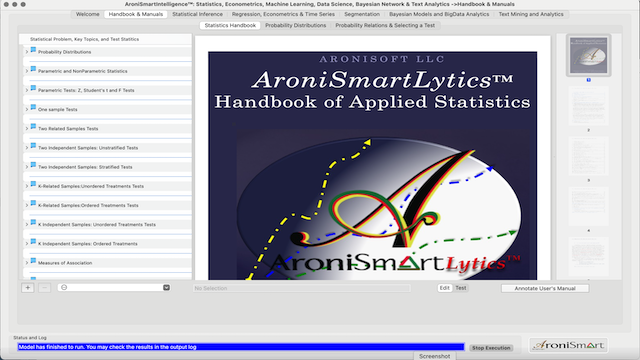
AroniSmartIntelligence™ module intended to address the needs related to a better understanding of probability distributions and statistics tests is in the Handbook and Manuals tab. The module includes three sub-modules (see below):
- Statistics Handbook,
- Probability Distributions, and
- Probability Relations and Selecting a Test
Advertisement
GET ARONISMARTINVEST, A LEADING INVESTMENT RESEARCH TOOL, BASED ON Advanced Analytics, machine Learning and Data Science on App Store -- click here 
AroniSmartIntelligence™ Statistics Handbook Module
Statistics Handbook is a reference about the statistical concepts, the most used probability distributions, the relationships among probability distributions, key statistical tests, and how to select the right statistical test. The Statistics Handbook module of AroniSmartIntelligence™ presents the user with a true statistical encyclopedia that covers the following:
- Statistical concepts: Statistical Methods, Parametric and Nonparametric statistics.
- Most used probability distributions: Discrete and continuous, their parameters, assumptions and properties.
- Relationship among probability distributions: the link among the key probability distributions.
- How to choose between parametric and nonparametric tests: which parametric test is appropriate in what situation.
- Key parametric statistical tests, including Z-test, t-test, F-test and Analysis of Variance (ANOVA) for fixed effects with random subjects: One-way, factorial, and nested design.
- Key non parametric statistical tests and how to select an appropriate nonparametric statistical test.
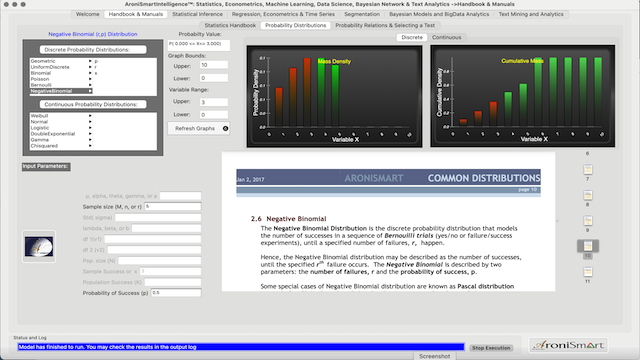
AroniSmartIntelligencet™ Probability Distributions Module.
In the AroniSmartIntelligence™ sub-module on probability distributions, the needed features and functionalities are readily available and should be referred to as often as possible, when exploring parametric statistics. The features include:
- Graphing Capability: Select a discrete or continuous distribution, and observe the graph of that distribution. Change the input parameters and see how the distribution changes its form and shape.
- Calculate the Probabilities: Select a discrete or continuous distribution and enter the input parameters and calculate the probabilities based on the selected distribution. Change the input parameters and see how the probability distributions change.
- Probability Function Statistics: Select a probability function and find the formulas in the embedded pdf document.
a. Discrete: Bernoulli, Binomial, Discrete Uniform, Geometric, Hypergeometric, Negative Binomial, and Poisson.
b. Continuous: Beta, Cauchy, Chi Squared, Double Exponential, Exponential, Fisher- Snedecor’s F, Gamma, Logistic, Lognormal, Normal, Pareto, Student’s t, Uniform, and Weibull. - Probability Function: Calculate probability densities or mass based on input parameters. The input parameters may be changed and updates can be made to generate charts and the probability estimates.
- Cumulative function: Calculate cumulative density based on input parameters. The input parameters may be changed and updates can be made to generate charts and the probability estimates.
- Confidence Intervals and Probability between low and upper values: By varying the upper and lower values and graphing, new probabilities are estimated.
- Graph Analysis: Graph probability and cumulative density functions based on input parameters. Vary input parameters and observe the changes in graphs. Graph bounds may be modified in the “Graph Bounds” form.
AroniSmartIntelligence™ Probability Relations and Selecting a Test Module
Probability distributions are connected and form one network with interesting relationships. AroniSmartIntelligence™ provides a graphical map of common distributions and their relationships, either as transformations or special cases.
This feature guides statisticians, data scientists and machine learning analysts in choosing the right distribution, understand the connections, and simulate distributions.
Another major feature covers the approach to selecting an appropriate statistics test, with two separate focuses:
- How to select parametric test. This visual representation maps on one page steps on how to select an appropriate parametric test and how to calculate the test.
- How to select nonparametric test. This visual representation shows the path from defining a statistical problem, choosing the type of data, selecting the non parametric test and describing the test itself, its assumptions and its mathematical and statistical properties..
More detailed capabilities of AroniSmartIntelligence™ are available in the tool on App Store and on the Aronisoft web site..
Advertisement
GET ARONISMARTINTELLIGENCE on App Store

AroniSmartIntelligence, the leading tool for Advanced Analytics, Machine Learning & Data Science
Statisticians, Data Scientists, Business and Financial Analysts, Savvy Investors, Engineers, Researchers, Students, Teachers, Economists, Political Analysts, and most of the practitioners use Advanced Analytics to answer questions, to support informed decision making or to learn.
AroniSmartIntelligence™ is a leading Advanced Analytics, Machine Learning and Data Science tool, with optimized cutting edge Statistics models, Econometrics, Big Data and Text Analytics.
AronismartIntelligence™ includes modules covering Machine Learning and Big Data mining, Unstructured Text Analysis, Sentiment and Emotion Analytics, Bayesian Statistics and other advanced analytics.
@2021 AroniSoft LLC
For More on AroniSoft LLC andAroniSmart products click here